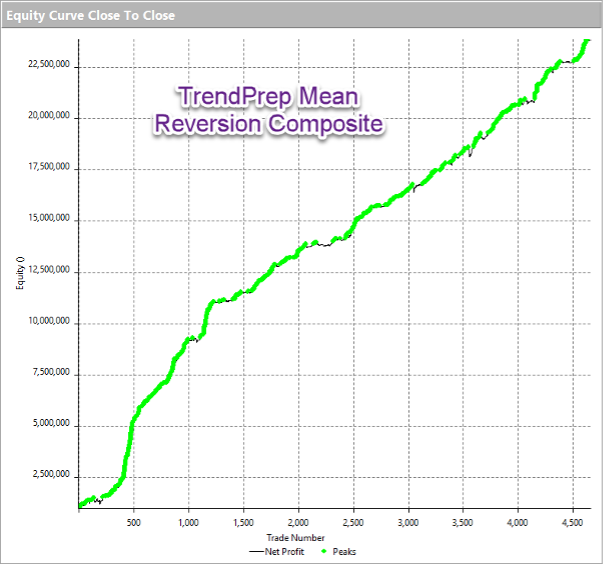
TrendPrep Strategies Introduction
One of the primary purposes for demonstrating the use of both the TrendPrep Indicator and the TrendPrep Averages in advance of writing this section is simply that these tools are at the core of all the strategies contained in this section and form an integral portion of the daily updates provided to members. Just as investors and traders may use traditional technical indicators to alert themselves to potential changes in a market’s directional movement, or whether it may currently be ‘overbought’ or ‘oversold’, one particularly efficient and powerful way to do all of this is to apply mathematical formulae to a data set and, assuming it has had some past positive statistical validity, it can aid and highlight future timing opportunities. As all the disclaimers will correctly indicate, past returns may not be indicative of future returns, however, as part of any preparation procedure, it is good to be aware of any logic that has been robust in past testing and may have the potential to remain so assuming general market characteristics do not change drastically. Of course, any logic can be followed blindly but as mentioned in previous articles, a visual validation process is always advisable, especially as markets can produce the unexpected with minimal notice.
At the outset, the strategies will form part of the U.S. Index sections. Given the substantial number of highly capitalized and very liquid components, as well as the inherent broad global participation, the nature of these is such that there is less price volatility than other global markets. This lends itself favorably for back-testing purposes. Before going into greater detail, listed below are the key points common to every statistical strategy featured within:
- The only initial data used is daily price in the form of Open, High, Low and Close.
- All have long and short ‘trades’ to create balance i.e., creating a ‘Long only’ strategy while testing during a persistent bull market may give overly optimistic results.
- Each uses the TrendPrep indicator or TrendPrep Averages as part of their logic (often both).
- Each strategy assumes a fixed monetary amount per back-tested ‘trade’ i.e., every decision is effectively of equal weighting and no money management is added for simplicity’s sake.
- The test period dates from 2007 to incorporate as many market extremes as possible.
Basic Strategy Overview
As a starting point for those who have not read earlier sections, it may be worth reading the section ‘Practical uses of Oscillators and Averages’ (LINK) which provides a brief overview of the 2-period RSI strategy for reference purposes. Although this is not intended to demonstrate a perfect solution, it does utilize many of the simple components which enable stability within such price-based strategies. This, in turn, can then generate higher percentage timing / turning points which are absent when using technical indicators alone. The 3 components are simply.
1) Define the trend.
2) Within this trend, look for timing points for entry (usually when the price pulls back or counter trends) e.g., as in the above strategy which uses an indicator to seek out extremes like oversold in an uptrend etc.
3) Exit when the price reverts from the extreme level to the ‘mean’ – In the RSI strategy, this equates to a closing level above a short-term moving average for long positions, and vice versa if short positions are enabled.