
TRENDPREP AVERAGES
At this point you will have some idea of the methodology and some ways to utilize the TrendPrep indicator. There are other additional uses, many of which will be demonstrated going forward. As has been discussed earlier, there are inherent weaknesses associated with trend following methodologies, primarily associated with the cost of time lag from ‘peak or trough.’ So, to minimize this challenge there are 2 simple, yet effective things that can be of help. Firstly, a layer of validation can be added to the indicator logic to support the directional bias. This can be achieved with the use of TrendPrep Averages (below). Last, but not least, once the trend direction has confidently been determined, adding an automated timing approach in the direction of the greater trend, which may produce potential timing points to enhance profits with minimal drawdown. This latter item will be introduced in the following pieces entitled ‘TrendPrep Strategies.’
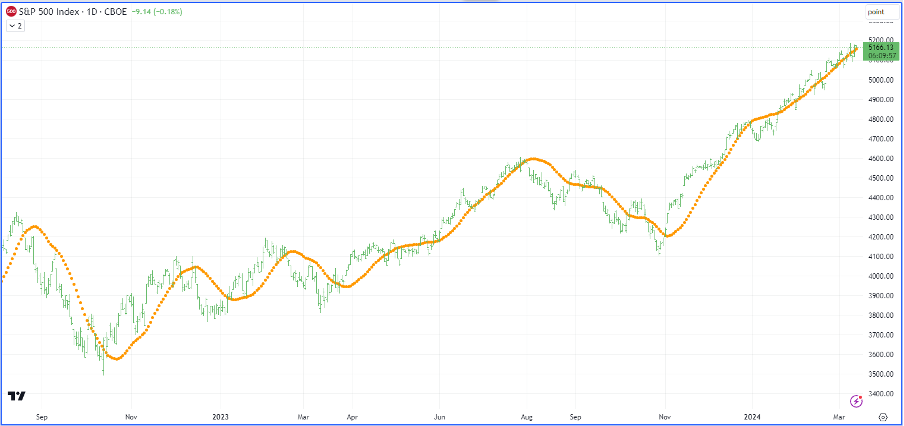
This is a basic pictorial representation of the TrendPrep Average, covering the S&P 500 index from the fall of 2022 to the spring of 2024. A 66 period / day lookback has been used simply as it represents approximately 3 months of trading days. As discussed in earlier articles, the problem with Simple Moving Averages lies in the sensitivity of the indicator. They tend to be overly sensitive with smaller look back values, and far too slow to react with higher look back periods. The TrendPrep Average is different in that it incorporates a momentum logic which acts as a stabilizer when in a sustained trend yet affords directional sensitivity as momentum changes. Let us look at a brief comparison of the TrendPrep Average versus a Simple Moving Average with the same look back parameters below.
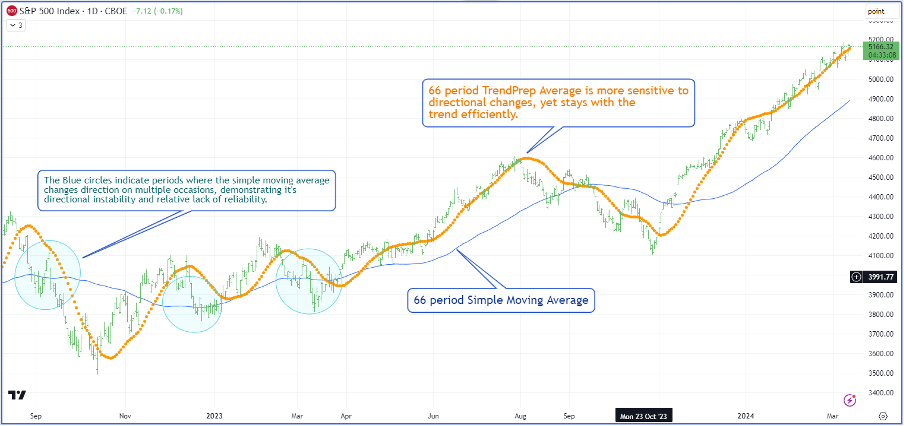
The above graph shows the TrendPrep Average in orange, while the Simple Moving Average line is blue. Considering they both have the same look back period, the difference in sensitivity and stability is stark. Although all trend following methodologies have the same lagging feature i.e., the security must move significantly from its recent high or low before a directional change can be confirmed, it is imperative that there is a degree of solidity and certainty surrounding the directional bias, as well as timely directional change. The 3 circles at the beginning of this graph show periods where the Simple Moving Average ‘flip flops’ from positive to negative as it tries to unsuccessfully determine direction. In addition, the timing is always slower than the TrendPrep Average, as well as lacking the same degree of persistence once the trend is ascertained. The TrendPrep Average is the superior indicator.
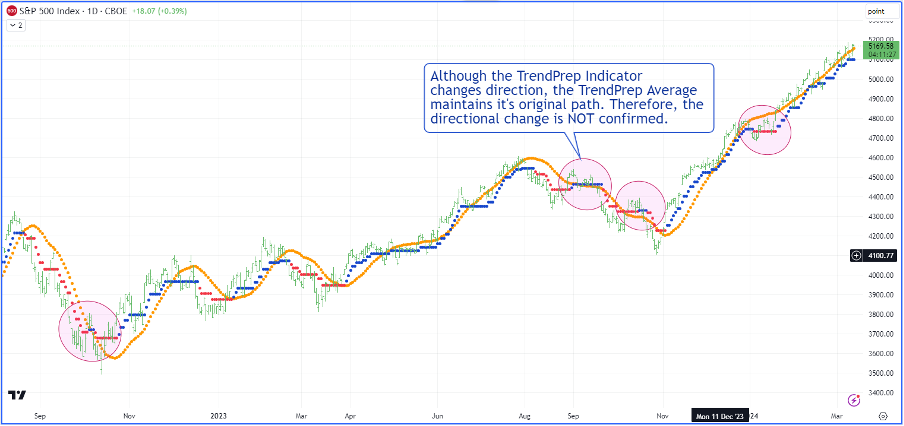
Now, if we add the TrendPrep indicator with the TrendPrep Average (above), the confirmatory directional process becomes clearer. When both indicators are heading in the same direction, the trend is more dependable with the additional validation. Both indicators should face the same direction to validate the current directional bias. The graphics within the red circles in the graph show 4 separate times when the indicators gave conflicting messages so, in such instances, no new direction should be accepted. The current bias remains in place.
This is another of the practical uses of the TrendPrep Indicator, using simple visual cues to determine current directional bias. Being able to instantly view and recognize where a market is most likely heading, using a minimal number of indicators, is an important part of the technical research process. It becomes more relevant when trading multiple instruments at the same time.