
One of the most popular tools used to determine trend is the Trendline. Even though the concept is quite simple, there are multiple types and ways to use them to good effect. There are many platforms that exist where trendlines can be drawn and monitored, and for an alert to be highlighted when the line has been breached. Many broker platforms will have this embedded within, so lines are easy to monitor when on the go.
Drawing and Recognising Breaks
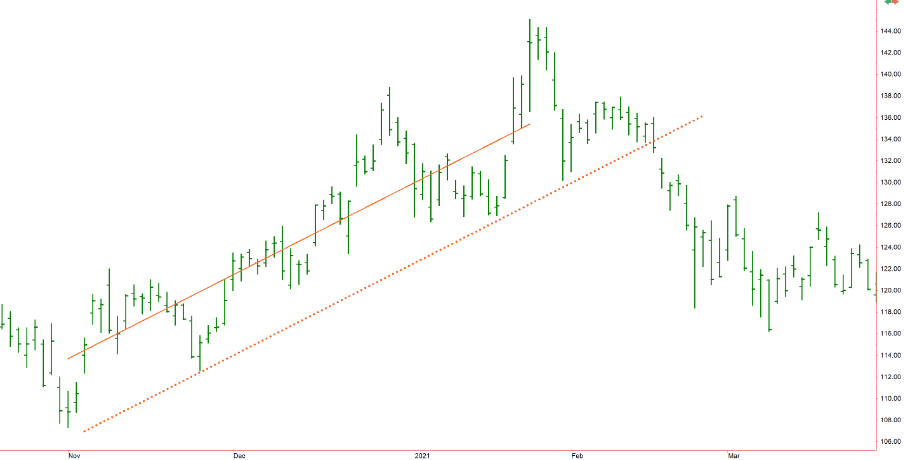
In their most simplistic form, these lines are very easy to draw, and can be effectively used to identify trend, or simply compliment or validate other strategies. All that is required are at least 2 visible reference points from which a line can be joined. We also need to consider the question of what constitutes a break of the line, and whether it should be re-drawn. Below are some simple examples…….
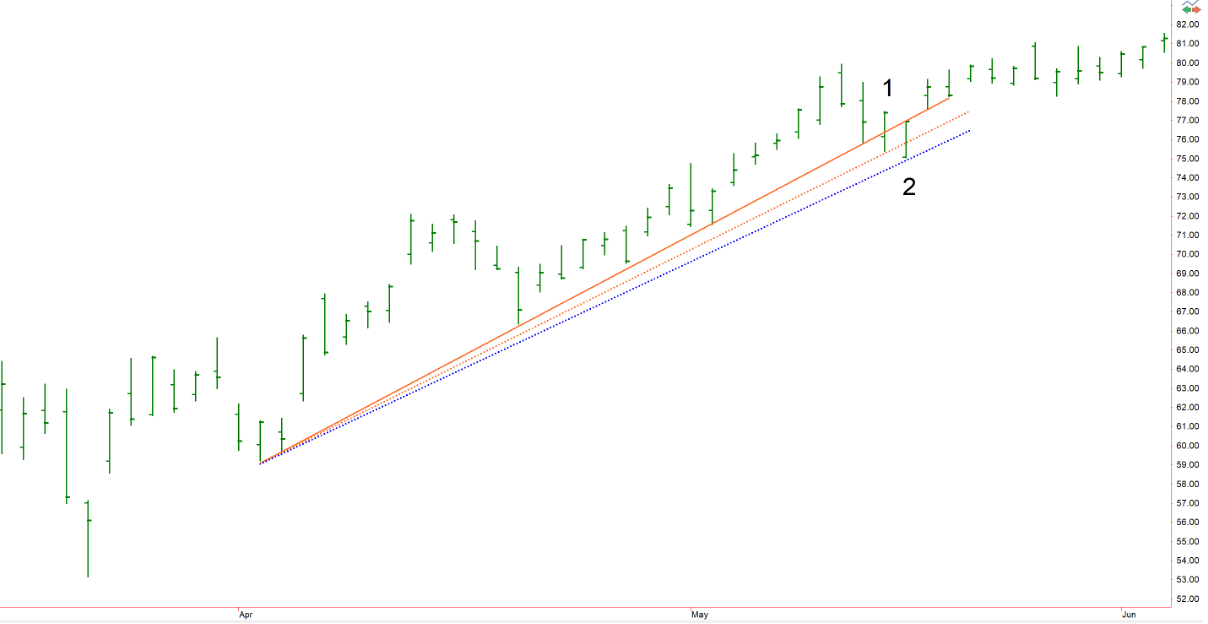
On the graph above, you will see 3 lines drawn. The bold orange line is the original trendline which touches the low point of several bars as it progresses. Such lines do not need to necessarily start at the bottom or top of a whole trend sequence but, as a rule of thumb, the more lows in the sequence it touches as it climbs, the more defined and dependable this trend may be. The same can be said of the length of the line which also hints at the stability and validity of the trend. A trend which only covers a few bars may not be as dependable to use.
Notice that the bar marked as ‘1’ is broken by the trendline, however, as the close of this bar is not below the trendline (unsuccessful break), the line is redrawn to include this bar’s low, from the point of the original line (orange dotted line) – This newly re-drawn line is then broken on the very next bar marked ‘2’ but, once again, the close is above the line so is re-drawn as before (Blue line). This process can be continued until the line has been breached by closing below the line.
On occasion, when not sure exactly where to place a trendline, another technique is to use a ‘linear regression line’ between the highest and lowest bars of a sequence, as with the solid orange line above. Linear regression in this instance is where the distance between the sum of closes above the line are equidistant to the sum of closes below the line. It is just a clean central dissection of the trend, from one point to another. This line is then copied and placed beneath the trend parallel to the actual linear regression line, at the lowest point it can touch. The line is then extended as the price moves forward until it is broken, as above (dotted line). It is worth becoming comfortable with some of the above as many broker or bespoke platforms have tools which make this easy both to monitor, and alert when a trend may be changing.
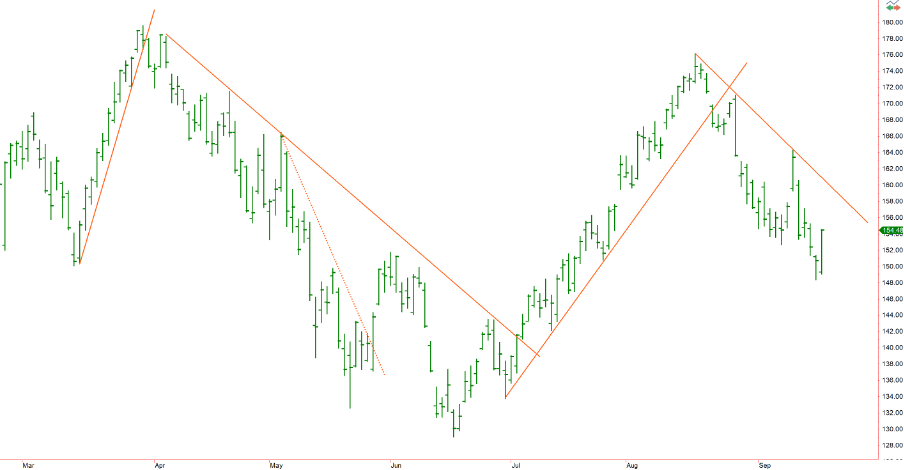
Eventually, your trendline graphs will start to take shape, defining trends by visual means. This type of technical analysis should really be considered more as a reference to generate potential visual trend changes and / or validation for statistically generated points of interest. This simple methodology can provide a powerful means of identifying and pinpointing trends and alerts to compliment and validate market direction.
A few other hints on this topic which may be useful throughout. Firstly, if a trend is very short or even difficult to define, try changing the timeframe to a shorter period e.g., from daily bars to 30-minute bars (or lower). This will often give greater clarity to help the decision-making process. Moving through various time frames to clarify trends is an important part of the trend seeking process, regardless of methodology. Next, although the above examples are using simple price data, some may use trendlines within indicators (e.g. RSI). Trendlines can be used on any type of graph. Finally, if using trendlines on a standalone basis, stick with very liquid stocks, Indices or other. Simply put, the more liquid the price series is, the less noisy and more predictable the graphs data will be, allowing for greater confidence and clarity.